An intervention plan whose progress chart draws itself.
“Progress monitoring meant somebody hand-entering numbers into a spreadsheet the night before the meeting.” — if that sounds familiar, this page is for you.
Try it free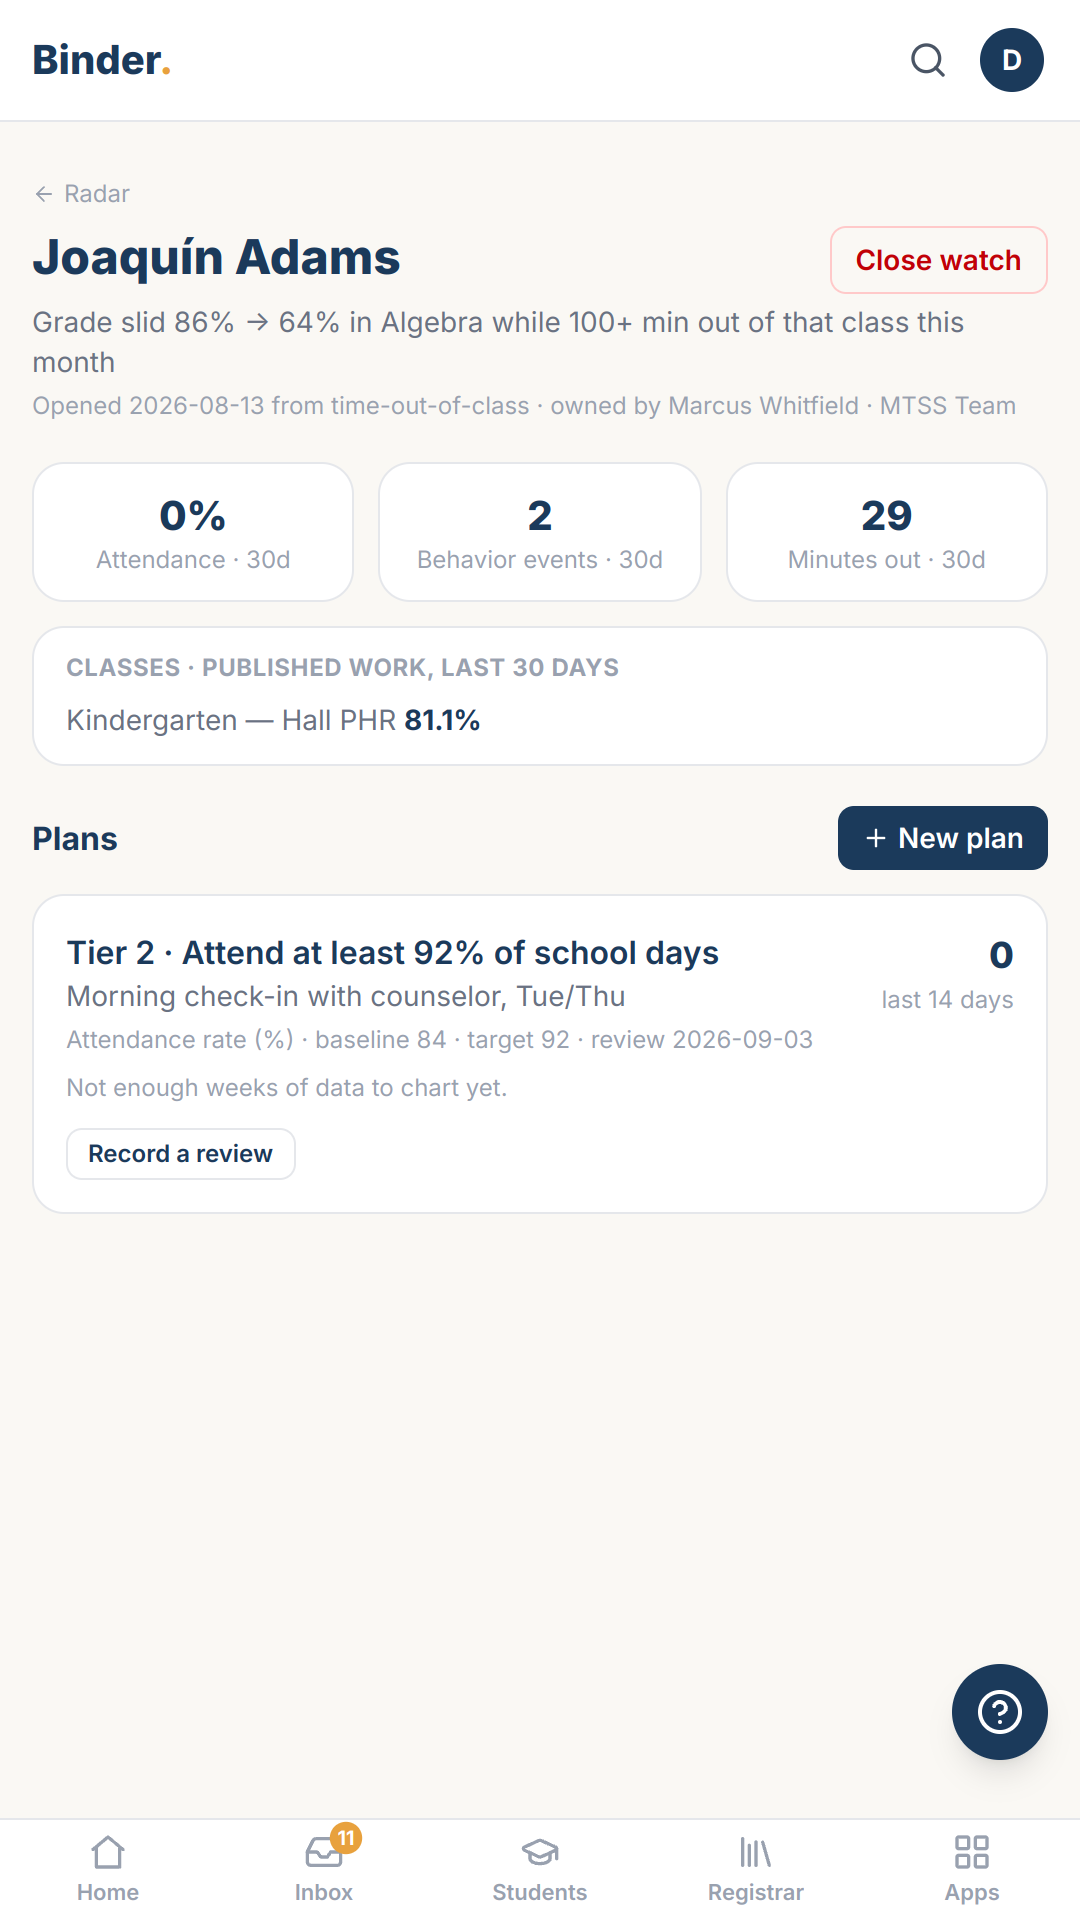
What it looks like
A plan card showing baseline -> current -> target with the weekly line, none of it typed.
Part of Radar
This is one piece of Radar — see the whole module for how it fits together.